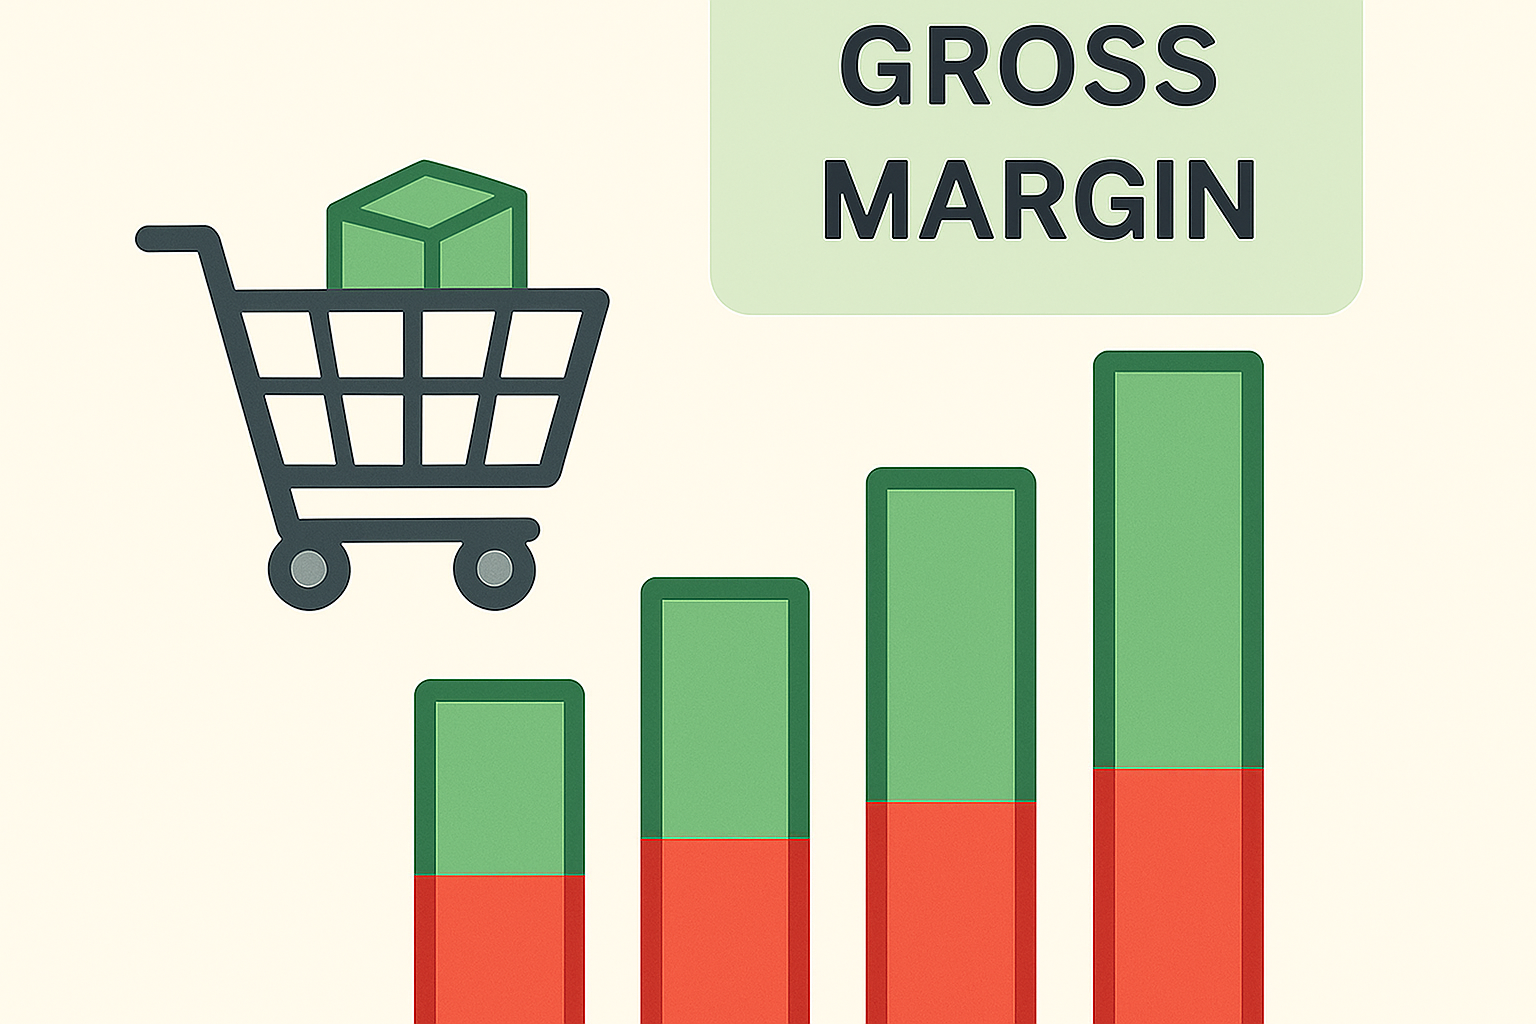
How much money is left for the company after paying all the costs directly related to the product or service offered?
Is my selling price appropriate?
Am I being more efficient than my competitors?
These are some of the questions that gross margin helps to answer.
This indicator shows how much profit the company retains from each sale after covering only the costs directly related to production or service provision — such as raw materials, direct labor force, and used materials. It excludes operational and administrative expenses such as rent, electricity bills, salaries, marketing, and others.
Gross margin is an essential tool for evaluating the operational efficiency of a business. It makes it possible to understand whether the company is managing to produce and sell in a profitably and efficiently way — and it also enables comparisons with competitors or internal goals.
What formula is used?
If you want to calculate it for a product, the formula will use COGS (Cost of Goods Sold).
If you want to calculate it for a service, the formula will use COPS (Cost of Provided Services).
Note that regardless of the variable used — be it COPS or COGS — we should apply the exact same logic in both cases. It’s basically a matter of terminology.
For a product:
Gross Margin (%) = (Revenue − COGS) × 100 / Revenue
For a service:
Gross Margin (%) = (Revenue − COPS) × 100 / Revenue
Below, we’ll break down each component of the formula.
Breaking down the formula
- Revenue = total amount of sales
- COGS (Cost of Goods Sold) = total expense to manufacture the product
- COPS (Cost of Provided Services) = total expense to deliver the service
Usage examples
Example 1
Suppose 10 glasses were sold for $10 each, totaling $100.
If each glass cost $4 to be produced and you sold 10 glasses, then:
- COGS = $40
- Gross Margin = 60% (meaning a gross profit of $60)
Example 2
Suppose a haircut was sold for $70.
If the cost of delivering that service was $15 (due to the use of shampoo, razors, creams, hair washing, etc.), then:
- COPS = $15
- Gross Margin = 78.57% (meaning $55 in profit)
Example 3
Imagine que duas empresas vendem um mesmo produto, obtendo os números abaixo:
| Company | Revenue | Cost | Gross Margin |
|---|---|---|---|
| A | $1000 | $600 | 40% |
| B | $1000 | $400 | 60% |
From this data, we can conclude that Company B has better apparent efficiency, which may be due to:
- Production of the product (the product is made with lower expenses, for example), or even:
- Better efficiency in purchasing raw materials
Think of another plausible hypothesis that might make sense.
Notes
You can use this indicator to measure a single item, a set of different items, or even your entire business revenue.
Some other ways of using it: you can use it for measuring things like efficiency per sale or across multiple sales; measuring it over a time period (weekly, monthly, biweekly).


